
The interface & basics explained
Summary / Learning objective
– Learn how to navigate the Cirrus interface.
– Understand the functions in the Cirrus Tool bar.
Menu Bar

From the menu bar, you can access your list of Cirrus Projects (on the left-hand side) and access your account information (right-hand side)
Tool Bar
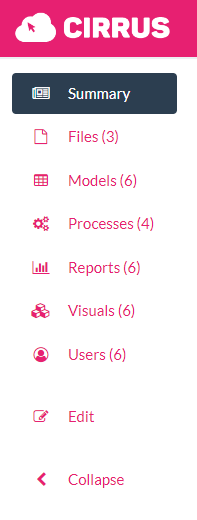
The Cirrus Tool bar is where you access all the functions of Cirrus from within a Project. A brief explanation of each option in the Tool bar is below:

- Contains an automatically generated overall summary of the resource, reserve and sensitivity models included in the Project.
- Includes a map of the location of the Project (This can be defined via the Edit option in the Tool bar)

- Upload and manage your block model and any data you wish to store in your Cirrus project. Once uploaded your data sits in the Cloud.

- Models contain the outputs from the runs you have completed in the ‘Processes’ tab.

- Define your resource, reserve and sensitivity analysis models to run in the Cloud.

- This is where reports will appear after running resource, reserve and sensitivity analysis runs.

- Visualise in 3D your block model and surface data here.

- Invite other users to collaborate on the project.

- Edit the Project settings including the Project name, description and location.
Any issues? Contact our support team on support@cirrusmine.com