
Using graphs and pivot tables
Summary / Learning objective
– Learn how to use graphs and pivot tables
Overview
Reports in Cirrus are automatically generated and customisable.
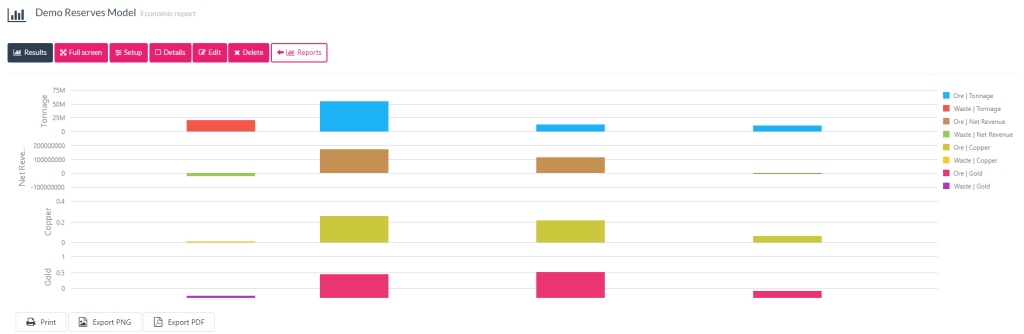
The Cirrus resource and reserve reports have 2 parts to them; an interactive graph at the top of the page and a customisable pivot table at the bottom.
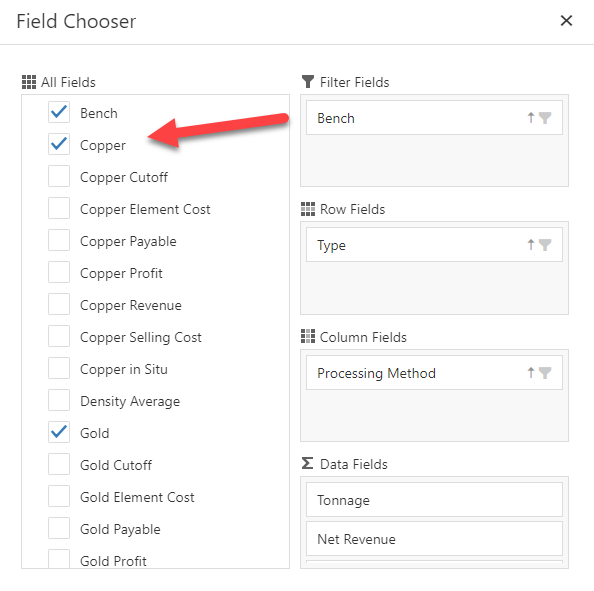
You can set up the data that you want to appear in the report via the field chooser or by manually dragging and dropping fields in the pivot table.
- Turn on and off fields via the Field chooser. The field chooser button is located on the right hand side of the pivot table:
2. You can then use the field chooser to turn on and off items from the model. You can also move items into different columns or rows.
3. You will notice when you close the Pivot table, the graph and pivot table will automatically update.
Any issues? Contact our support team on support@cirrusmine.com