
What reports are available?
International guidelines establish standards for all written disclosure made by an issuer concerning mineral projects that are reasonably likely to be made available to the public.
Resource Report
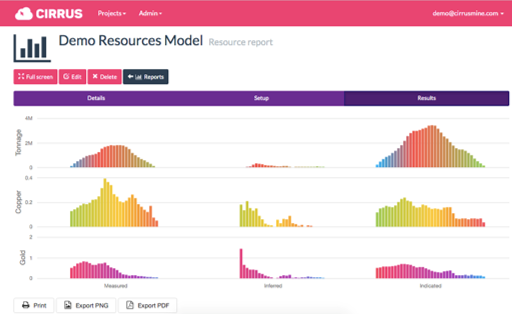
Technical reports of mineral resources must identify one or more categories of inferred, indicated and measured resources. Resources categories must not be reported in combined form unless details of the individual categories are also provided. International guidelines also require that inferred mineral resources cannot be combined with other categories and must always be reported separately.
Economic Report
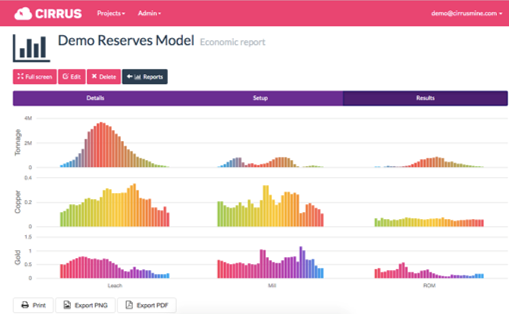
Economic reports are the basis information for mineral reserve statements as they should be unambiguous and sufficiently detailed for a knowledgeable person to understand the significance of, for example, cut-off grade and its relationship to the mineral resource. Technical reports of mineral reserves must specify one or both categories of proven and probable.
Sensitivity Reports
Cumulative distribution
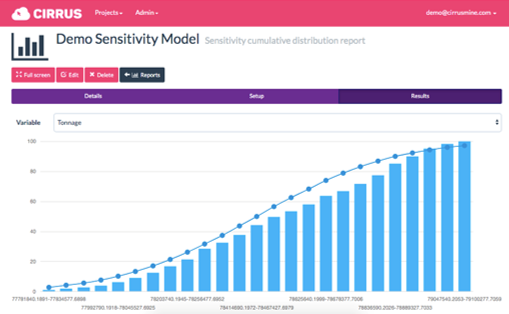
Cumulative distribution (CDF) is a function that provides the probability that a random variable is less than or equal to a given limit value. Cirrus uses the probability theory to analyse the outcomes of simulated dependent variables, like ore tonnes and grades, to assess the probability associated with the n-dimensional simulated scenario.
Matrix
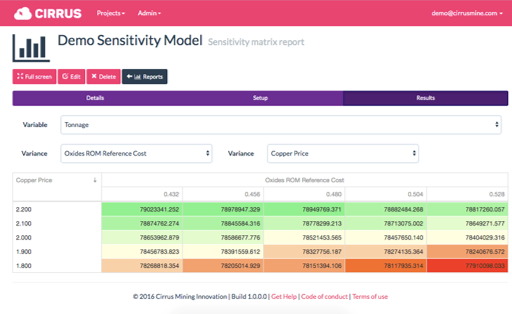
The sensitivity matrix illustrates a qualitative measure of risk in the two-dimension and three-dimensional spaces. The sensitivity matrix is a unique tool developed by Cirrus for qualitative risk assessment on mineral resources and reserves.
Spider graph
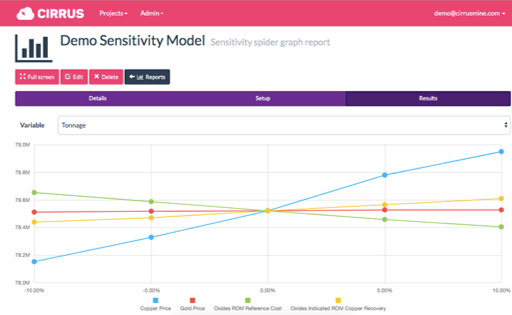
Spider graphs are very useful for deterministic sensitivity analysis when evaluating and comparing the relative impact of independent variables on dependent variables, such ore tonnes and grades. Each simulated input variable considered in this type graph is modelled to incorporate percent changes on their baseline input values, while all other independent variables are held at original values.
Tornado Diagram
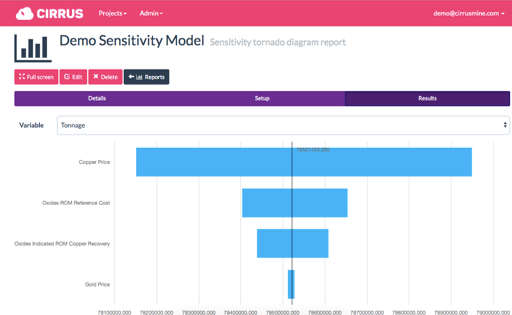
Tornado diagrams, also called tornado plots or tornado charts, are a special type sensitivity analysis graph, where the simulated variables are ordered from top to bottom according to the isolated impact that a given input variable has over the output variables. The tornado diagram is very useful for deterministic sensitivity analysis and is so named because the final chart visually resembles a complete tornado.